using GMT

plot(rand(5,3), region=[0,1,0,1])
vlines!([0.2, 0.6], pen=(1, :red), show=true)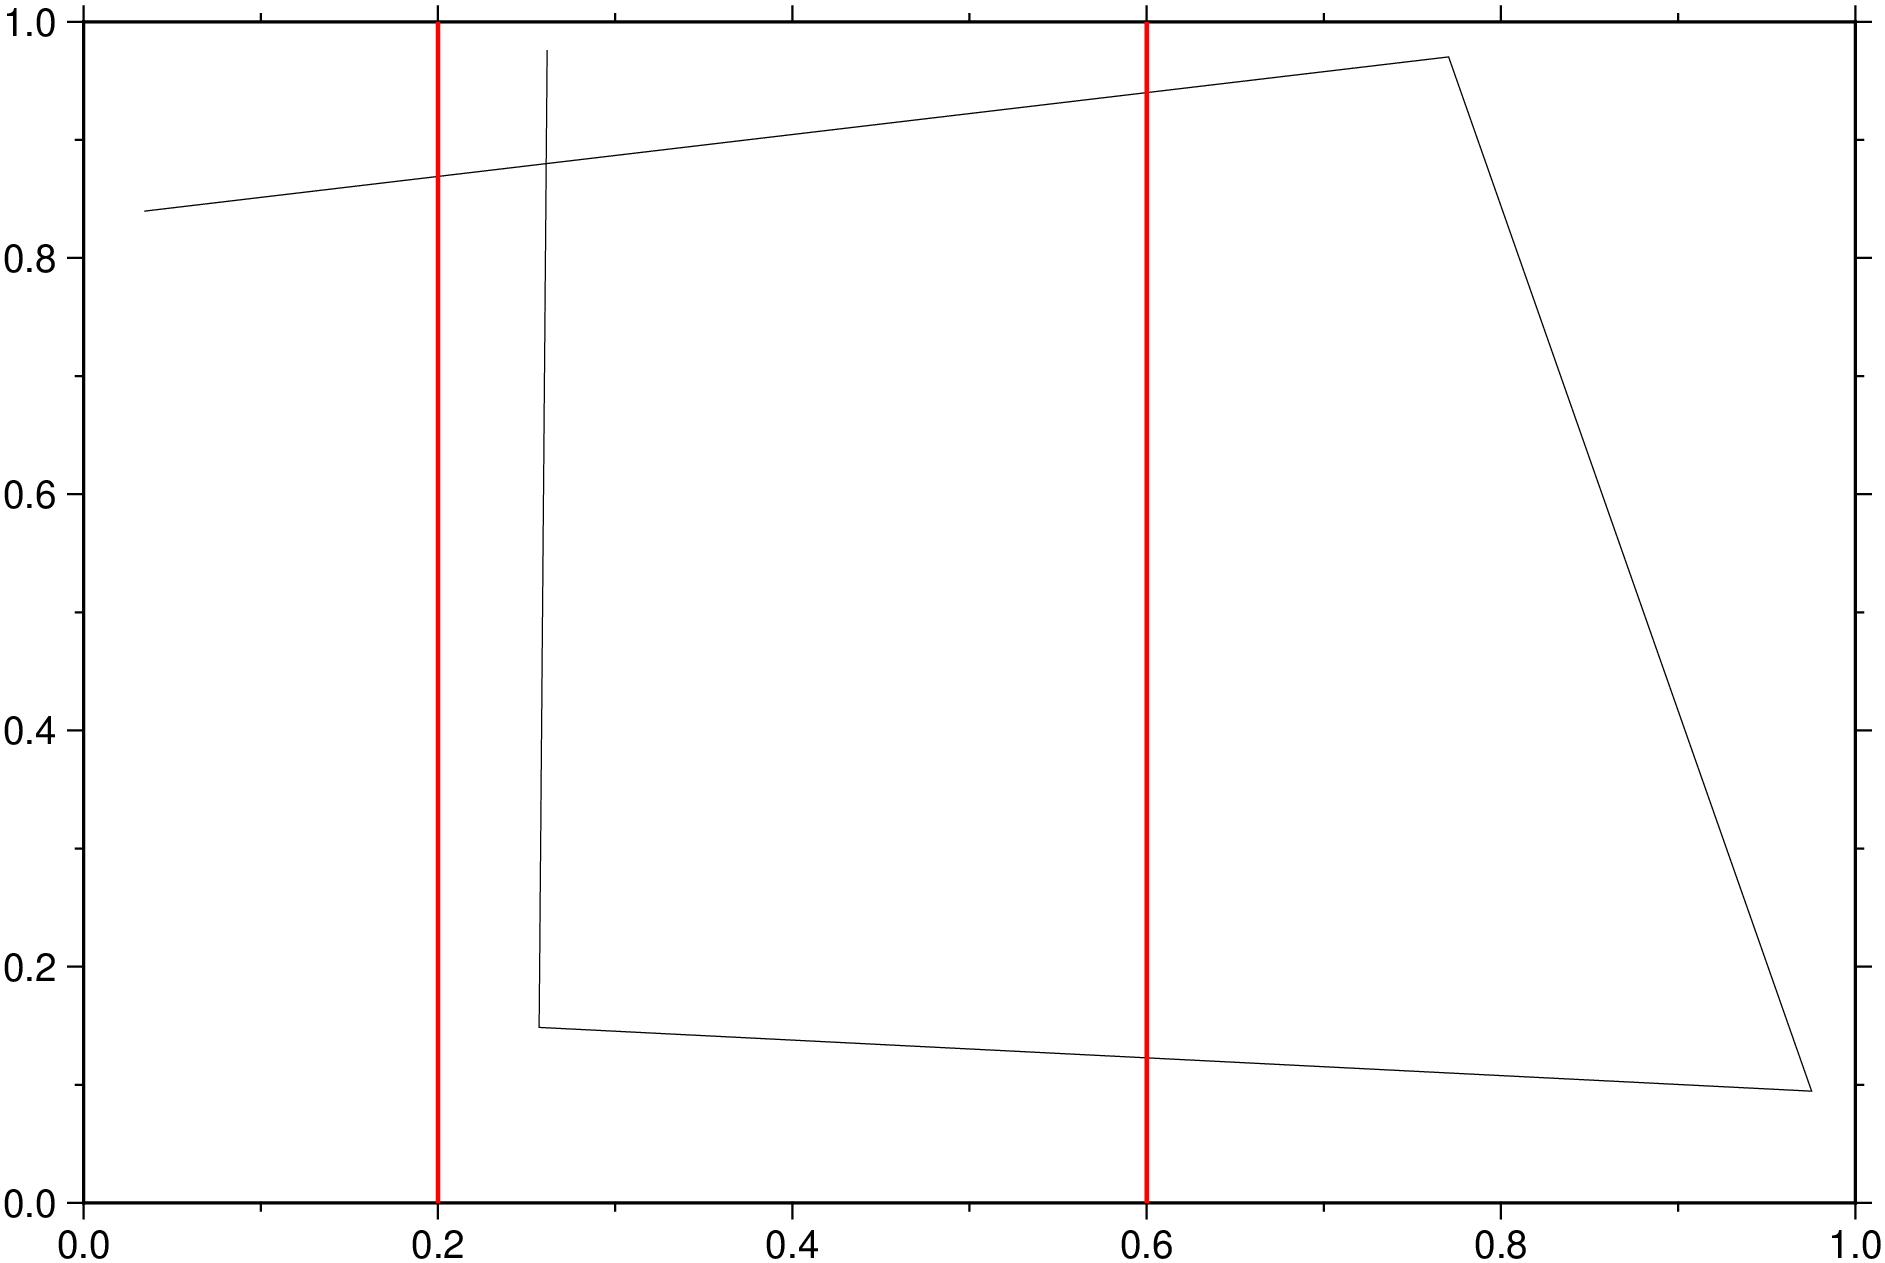
vlines(arg; decorated=(...), xmin=NaN, xmax=NaN, percent=false, kwargs...)Plots one or a collection of vertical lines with eventual decorations
ymin & ymax: Limit the vertical lines to start a ymin and/or end at ymax
percent: If true the xmin & xmax are interpreted as fractions of the figure width.
B or axes or frame
Set map boundary frame and axes attributes. Default is to draw and annotate left, bottom and vertical axes and just draw left and top axes. More at frame
J or proj or projection : – proj=
Select map projection. More at proj
R or region or limits : – limits=(xmin, xmax, ymin, ymax) | limits=(BB=(xmin, xmax, ymin, ymax),) | limits=(LLUR=(xmin, xmax, ymin, ymax),units=“unit”) | …more
Specify the region of interest. More at limits. For perspective view view, optionally add zmin,zmax. This option may be used to indicate the range used for the 3-D axes. You may ask for a larger w/e/s/n region to have more room between the image and the axes.
W or pen=pen
Set pen attributes for the arrow stem [Defaults: width = default, color = black, style = solid]. See Pen attributes and Vector attributes for arrow line terminations.
U or time_stamp : – time_stamp=true | time_stamp=(just=“code”, pos=(dx,dy), label=“label”, com=true)
Draw GMT time stamp logo on plot. More at timestamp
V or verbose : – verbose=true | verbose=level
Select verbosity level. More at verbose
X or xshift or x_offset : xshift=true | xshift=x-shift | xshift=(shift=x-shift, mov=“a|c|f|r”)
Shift plot origin. More at xshift
Y or yshift or y_offset : yshift=true | yshift=y-shift | yshift=(shift=y-shift, mov=“a|c|f|r”)
Shift plot origin. More at yshift
figname or savefig or name : – figname=name.png
Save the figure with the figname=name.ext where ext chooses the figure image format.
using GMT
plot(rand(5,3), region=[0,1,0,1])
vlines!([0.2, 0.6], pen=(1, :red), show=true)
This function has multiple methods:
vlines(; ...) - plot.jl:1493vlines(arg1; first, ymin, ymax, percent, kwargs...) - plot.jl:1493